pH measurement has many uses. Here are some examples: Growing plants with hydroponics, managing swimming pool conditions, monitoring aquarium health, and for all sorts of laboratory and industrial uses. This article shows how you can use a Raspberry Pi to read pH, log it, and integrate it with other sensors and systems.
pH (potential, or power of hydrogen) is how how acidic or basic a water-based solution is. More specifically, it's the concentration of hydrogen ions (H+) present in a the solution. It's measured on a logarithmic scale ranging from 0 to 14, and is measured on a logarithmic scale. A solution with pH of 7 is neutral (neither acidic nor basic). Solutions with pH below 7 are acidic, and above 7 are basic. Measuring pH is important for many uses, since all sorts of chemical processes are sensitive to it.
pH can be measured with color-changing strips, digital meters, or sensors connected to any micro-controller. The Raspberry Pi is a popular method in the DIY community. Compared to others, it's easy to customize, or integrate into a more complex setup. Pi-based tools like Mycodo make it easy to combine readings from many sensors into one interface, that can be viewed from any device on your network.
The Pi's easy-to-use, and has a large, supportive community - this makes it easy to get get started, and find help.
The most common type of pH sensor is called the glass electrode. It works using two electrodes, each surrounded by a glass membrane that selectively lets hydrogen ions through. The electrodes are usually made out of Silver Chloride (AgCl). The two electrodes are usually housed together in the same probe, but are sometimes separate. One is connected to the solution being measured by the membrane; the other to a reference solution (either liquid or gel) of neutral pH. The flow of hydrogen atoms creates a small voltage between the electrodes (usually 0 to ±400mV) that varies with pH. If you see the world probe, it means the same as sensor.
Some glass electrodes use a double-junction design. These provide a barrier between electrodes. They're better suited towards continuous immersion, or in dirtier solutions than single-junction designs, and they have a longer shelf life.
To read pH from a glass electrode, you need to convert the voltage is generates to digital form. There are circuits available to do this - the details of how they work vary, but the idea's the same: Match the high impedance of the sensor to the low impedance of the electronics using an operational amplifier (op amp), then convert the analog signal to digital using an analog-to-digital converter (ADC). Code can then interpret the digitized voltage as pH. (See the charts on our pH calibration article for info on how to do this.)
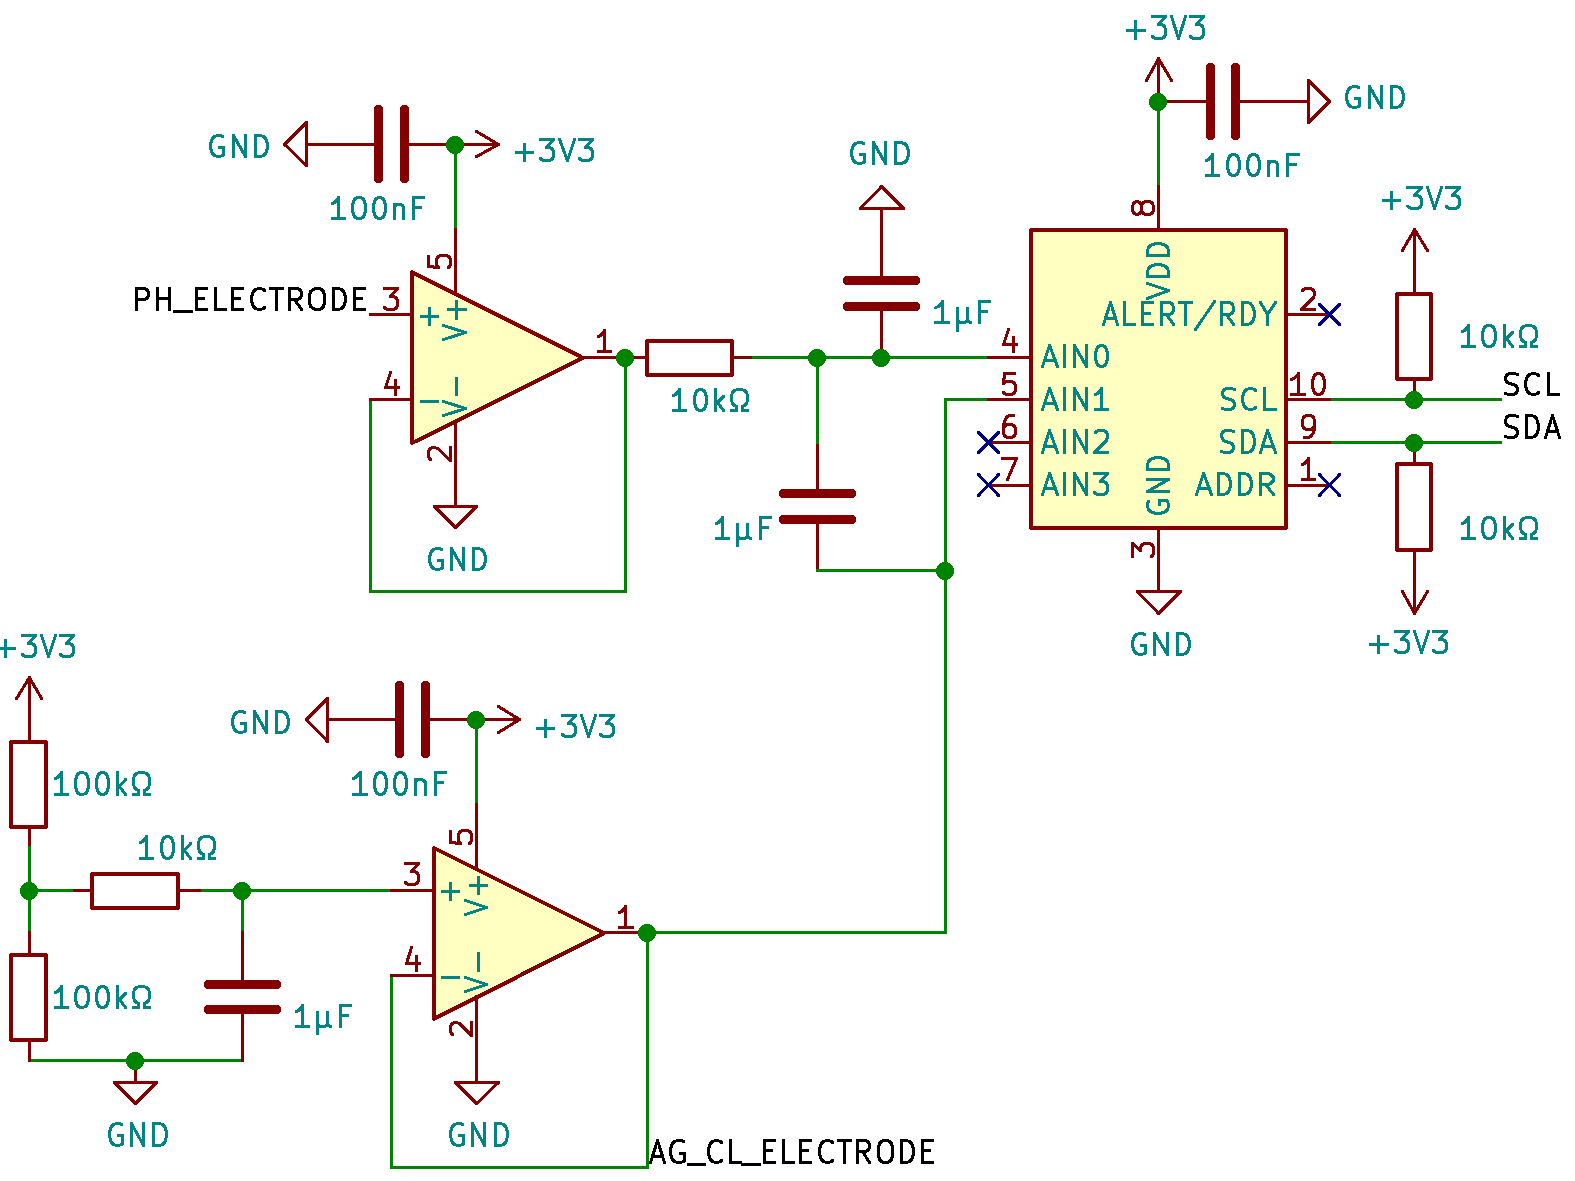
It uses 2 opamps (triangles) in a unity-gain configuration to match impedances, an I2C ADC, and some resistors and capacitors to filter noise out of the signal and power.
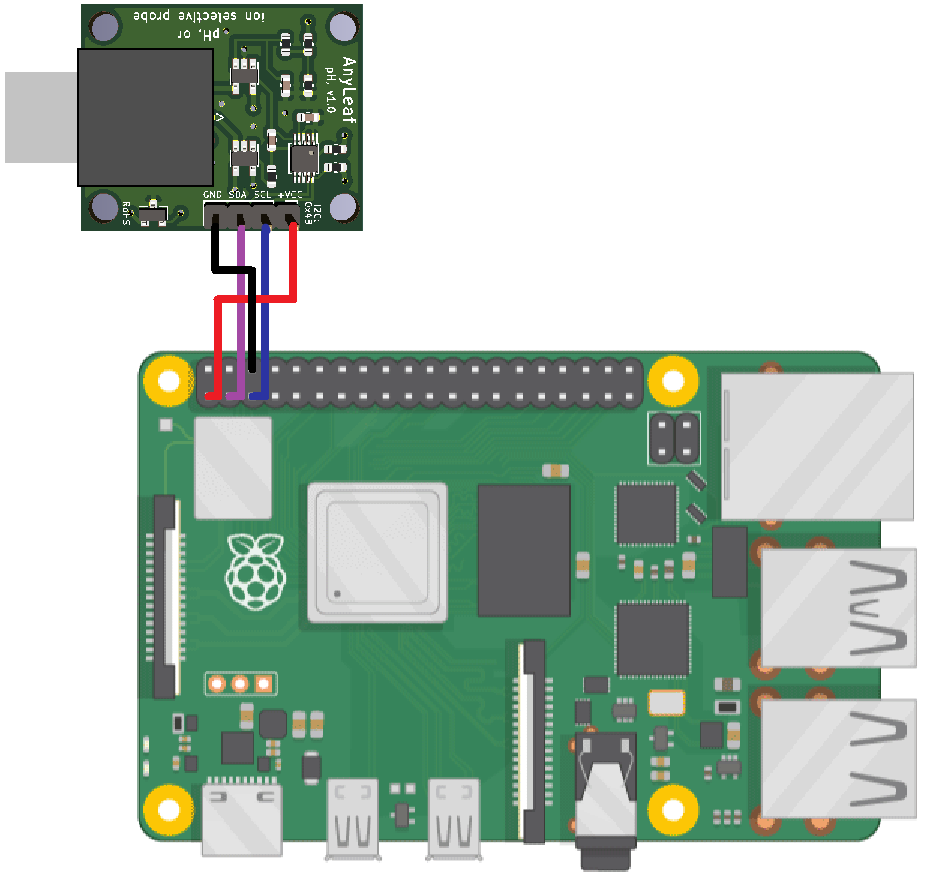
The circuits can connect to your Pi a few different ways. They usually use 4-6 wires connected to GPIO pins, or the USB port. GPIO circuits get power by connecting to a 3.3V or 5V pin, and a ground pin. They also connect to either UART, I²C, or SPI pins to send and receive data. For example, the Atlas-Scientific circuit uses UART or I²C; the AnyLeaf module uses I²C, and the AnyLeaf Water Monitor uses USB. Some circuits (like the Chinese ones available on Amazon, ebay etc) use a custom protocol.
The way to get measurements depends on the circuit - the best way is to reference the circuit's instructions or datasheet. Some circuits convert the probe's raw voltage to pH on a microcontroller, while others send it to your Pi, where calibration and interpretation are done with software.
Your circuit may include a Python package to make it easy. For example, Atlas Scientific provides this guide, and AnyLeaf provides this package: pip install anyleaf.
You could connect a display to your Pi, and display readings on a screen. You could use a SPI or I2C display (connects to GPIO), and use the display's software or datasheet to continuously show readings. Or, use an HDMI display and show readings using a GUI application or webapp.
You can set up your Pi to act as a local server, letting any PC, phone, or tablet on the network see readings. Micro frameworks are ideal for this, like Flask in Python, or Rocket in Rust. Alternatively, you could modify this approach to create a private internet server, so you can view readings when away from home.
Consider logging readings to a file or database. You can then observe trends and learn more about the system you're measuring. Plotting libraries like Matplotlib and Bokeh make visualization easy.
A simple way to get started with logging is by writing to a CSV file. Python comes with Raspbian, and makes it easy to do this. See this official Python tutorial on reading and writing files for details on how to open files, and write lines to them. For the most basic approach, take a reading, write the reading and a timestamp to a CSV row, then wait an interval, and repeat. This is really easy - here's an example. It uses the AnyLeaf pH module, but you could modify it to use others:
import datetime as dt
import time
import board
import busio
from anyleaf import PhSensor, OnBoard

LOOP_DELAY = 60 * 5  # Time to sleep, in seconds.
LOG_FILENAME = "ph_readings.csv"


def main():
    i2c = busio.I2C(board.SCL, board.SDA)
    ph_sensor = PhSensor(i2c, LOOP_DELAY)

    while True:
        ph = ph_sensor.read(OnBoard())
        timestamp = dt.datetime.now()

        # Open our log file in append-line mode. This way new lines can be
        # written without overwriting existing ones.
        with open(LOG_FILENAME, 'a') as f:
            # Write the timestamp to the first column, and pH to the second.
            f.write(f"{timestamp.isoformat()},{round(ph, 2)}\n")

        # Wait for 5 minutes before taking and logging another reading.
        time.sleep(LOOP_DELAY)


if __name__ == "__main__":
    main()
Consider logging other readings along with pH, like temperature and conductivity. If you're making a more complicated CSV, consider using Python's CSV module. Alternatively, you can use whatever language you want. You can open the resulting CSV log file in a spreadsheet program like Excel or LibreOffice, or a text editor.
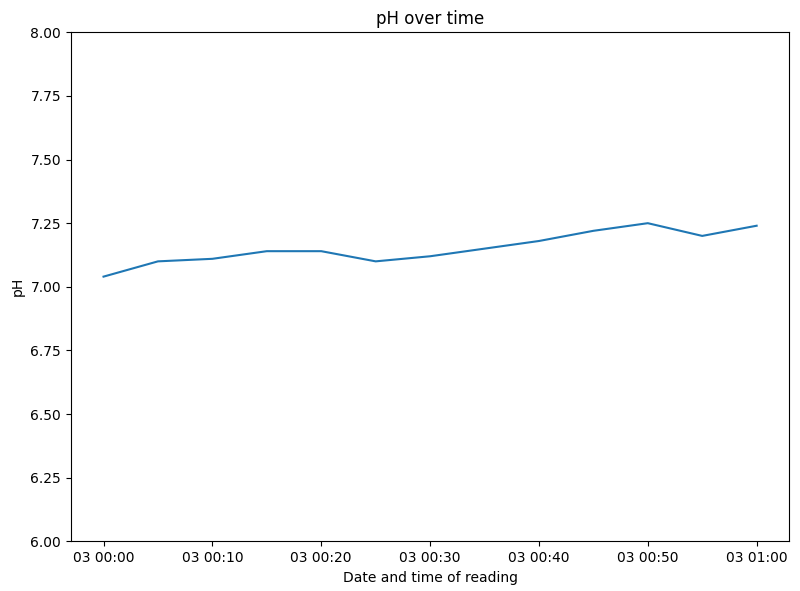
Once you've logged your data, you probably want to visualize it. A simple way to do this is by plotting with matplotlib or Bokeh. The specifics will depend on what format you logged your data in. Here's a Python example using matplotlib, and the CSV data generated by the logging example above. It uses the CSV module from the standard library, mentioned above:
import csv
import datetime as dt
import matplotlib.pyplot as plt


LOG_FILENAME = "ph_readings.csv"


def main():
    """Plot readings over time, from a CSV log file."""
    timestamps = []
    readings = []
    with open(LOG_FILENAME) as f:
        reader = csv.reader(f)
        for (timestamp, ph) in reader:
            # Parse the timestamp into a `datetime.datetime`.
            timestamps.append(dt.datetime.fromisoformat(timestamp))
            readings.append(float(ph))

    fig, ax = plt.subplots()

    ax.plot(timestamps, readings)  # Use `ax.scatter(...)` for a scatterplot.

    ax.set_title("pH over time")
    ax.set_xlabel('Date and time of reading')
    ax.set_ylabel('pH')
    ax.set_ylim(6, 8)

    plt.show()
Here's an example plot made with that code. Check out this official Pyplot tutorial, or Matplotlib's docs for more info on changing plot style.
You may wish to apply a lowpass filter on your data to remove jitter. Some circuits have a built-in analog lowpass filter - for example, an RC circuit (Resistor in series; capacitor to ground). The key assumption is that pH is relatively steady over time, so fluctuations are likely to be noise. (An exception to this is moving your probe in and out of solution, or between solutions) You can also apply digital lowpass filters in software. For example, check out the filtering functions available in Scipy. A single-stage IIR filter has fast performance, and may be good enough.
If you're using C or Rust, check out the filters from CMSIS-DSP. Where to set the cutoff frequency is subjective, but it can be set very low.
A simpler solution than FIR or IIR is a moving average filter - this is easy to code and understand, and works well for this situation. The more values used in the average, the smoother the result will be. The result will also be lagged, proportional to number of values. To implement a moving average, store a list or array of values. Each time you read from the sensor, shift all values 1 to the left, and add the new value on the right. Your filtered reading is the average of this list.
Mycodo is an easy-to-use service for integrating sensors and other systems (eg automation) into web-based dashboard on a local network. You could combine your pH readings with other readings, like temperature, ORP, and conductivity. You could also integrate with systems like pH dosing, water-level monitoring, lights, and pumps.
Consider integrating pH measurements with a system that adjusts pH using modifier chemicals (eg 'pH up' and 'pH down'). You could trigger a notification to add modifiers when pH goes out of a set threshhold. Consider a notification not just that pH is out of range, but how much modifier to add to get it back to an ideal range. For an automatic setup, consider building a pH doser that automatically reads and adjusts pH using pumps. For an example, check out our example project on building a pH doser.